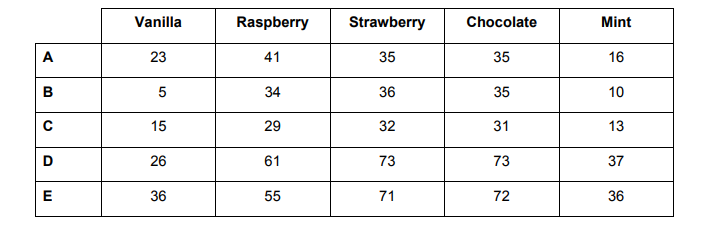
The pie chart shows the favourite ice cream flavour for a sample of students in a school.
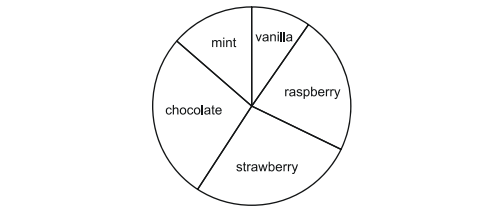
Which one of the rows in the table below could show the number of students who chose each flavour?
The pie chart shows the favourite ice cream flavour for a sample of students in a school.
Which one of the rows in the table below could show the number of students who chose each flavour?
Some Quick Questions to ask yourself when doing this type of problem solving:
This question is trying to overwhelmed you, but we can solve most, if not all without actually using the numbers in calculations. The best approach is to pick a reference and then narrow down your options. A reference should be something easy to work with and quickly identifiable, in this problem, a good reference would be to use strawberry ice cream as roughly a quarter of the students. This is because it is about 1/4 of the graph. Now, we can also make relationships between the flavours. The amount of students that like chocolate is more than the amount of students that likes strawberry, so continue to make these relationships until you have something like this:
Chocolate > Strawberry > Raspberry > Mint > Vanilla.
But note that the difference between strawberry and chocolate is difficult so we will take this into consideration.
This will be our first way to eliminate options. We can now put each option in the same format as this too:
A. Raspberry > Strawberry = Chocolate > Vanilla > mint. Therefore this cannot be the answer.
B. Strawberry > Chocolate > Raspberry > Mint > Vanilla.
C. Strawberry > Chocolate > Raspberry > Vanilla > Mint. Therefore this cannot be the answer
D. Strawberry = Chocolate > Raspberry > Mint > Vanilla.
E. Chocolate > Strawberry > Raspberry > Vanilla = mint. Because vanilla and mint are equal in this option but not close in the graph, this cannot be the correct answer.
Now we are left to decide between B and D, what are their differences? For starters, strawberry and chocolate, in B strawberry > chocolate (even though barely) and in D they are equal. This would be hard to judge off, so are there any other giveaways? Lets move onto raspberry, mint and vanilla. Looking at the graph, we can say that mint + vanilla is almost equal to raspberry (albeit slightly larger). In B, mint + vanilla = 15 , while raspberry is 34, more than twice as big. In D, mint + vanilla = 63 , while raspberry = 61. They are almost the same but mint + vanilla is barely bigger here. Therefore we can conclude that D is the answer.