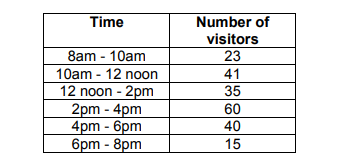
The number of visitors to the local swimming pool at different times on Wednesday last week is recorded in this table:
Which chart shows the data from the table?
The number of visitors to the local swimming pool at different times on Wednesday last week is recorded in this table:
Which chart shows the data from the table?
To solve this question, we need to apply the following concepts:
All three can be trained by solving past papers questions of similar exams.
To answer this specific question, you will need to understand the table before checking the options. Let’s try to see what we can deduce from the table;
Now that we understand the table, we can look at the options we realize that each column should represent a row in our table. We also understand that while we have the X values, we don’t indicate how “tall” each column should be compared to the Y value.
This moment is where spatial recognition comes into place. We need to estimate how tall each column is compared to its neighbors.
1 must be shorter than 2, and around half the size
2 must be a bit longer than 3
3 must be shorter than 4, and around half the size
4 is taller than 5, but 5 is taller than 1,3 and 6
5 is taller than 6, which is the shortest of all.
We can now eliminate each option by reviewing the data we deduce from the table and checking the columns in order.
1 must be shorter than 2, and around half the size
All options seem possible.
2 must be a bit longer than 3
We can eliminate B, C, and D
3 must be shorter than 4, and around half the size
Both A and E
4 is taller than 5, but 5 is taller than 1,3 and 6
E is our answer
5 is taller than 6, which is the shortest of all.
Both A and E, but we already got our answer.
