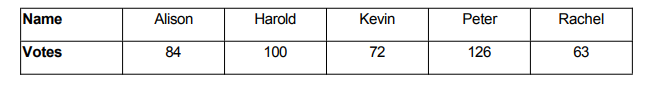
The table below shows the number of people who voted for each candidate in the recent school election:
When drawing a pie chart of the results one of the numbers above was not read correctly (the other four were correct). The angles were calculated as 113.4 degrees, 90 degrees, 75.6 degrees, 56.7 degrees, and 24.3 degrees.
Whose score was copied incorrectly when the pie chart was constructed?
This question is mainly based off of assumptions we can make by analyzing the table.
The first thing we can notice is that between all candidates, Peter scores highest- therefore we can assume he takes the 113.4 degree angle.
If so, we can also see that Rachel has exactly half the amount of votes of Peter- which means her angle should be exactly half of 113.4 degrees. 113.4 divided by 2 is 56.7 degrees.
Here we can safely assume both Peter and Rachel are safe.
Our remaining angles should be: 75.6 degrees, 90 degrees and 24.3 degrees.
Our next observation is that Allison has exactly 1.5x the amount of votes Peter has. If so, her angle should be 113.4 divided by 1.5. This gives 75.6 degrees which is consistent with our Pie chart.
Allison, Rachel and Harold’s scores are all correctly copied.
But, when we look at the table- we know that Rachel has obtained the least possible votes, which means she upholds the smallest angle. Hence, between 90 degrees and 24.3 degrees there cannot be an angle less than Rachel’s 56.7 and we conclude that 24.3 is the outlier.
Now we have two people left; Harold and Kevin. The person who obtained the least votes between the two should obviously have the smaller angle, Harold manages 100 votes and Kevin manages 72, which leads us to conclude Kevin’s score has been copied incorrectly.