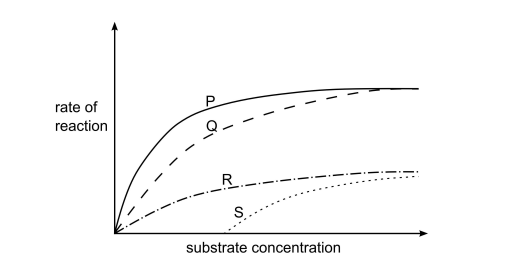
As we increase the substrate concentration, we should see a constant increase in the rate of reaction as long as there is substrate available to bind to. This therefore, should look like curve P.
With competitive inhibitors, we must know that the end result reached under optimal conditions and the same substrate concentration, is the maximum rate of reaction still being reached. The difference is, is that the reaction should take longer because of this “competition”. In other words, the rate of the reaction should be slower.
Therefore for statement (2), we must choose an option in which the rate of reaction is lower, but we still reach it’s maximum. This should be option Q.