Simple steps to solve word problems:
- Underline key information
- Determine what they are trying to ask, and what you will need to solve it
- Eliminate any non-essential information
- Draw a picture, graph, or equation
- In moments of high stress like exam taking, always work with the paper they give you to avoid careless mistakes.
- Solve.
This question is just trying to overload you with information. The best approach is to tackle each statement and try to disprove it.
Pro-Tip: Save these types of wordy questions for last, solve all the easier exam problems and come back to this one in order to get the easy points done first.
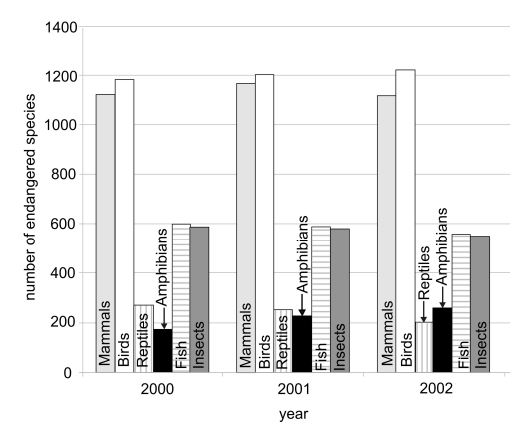
A The number of species of insects that were endangered was almost equal to the number of species of fish that were endangered over the three-year period.
Looking at the graphs, we don’t even need the numbers to see that the fish and insect bars are consistently around the same level. We can conclude just by ‘eye-balling’ that A is the correct answer.
B The number of endangered species of mammals remained constant over the three-year period.
Although the number of endangered species of mammals is the same in the first and third years, we cannot say that it remained constant over the total period because there is an increase in the second year. To eliminate this answer, you have to carefully read and make sure you know what is being asked of you. B is incorrect.
C The number of endangered species of reptiles increased over the three-year period while that of amphibians decreased.
This is opposite to what is true, looking at the graph we can clearly see that the number of endangered species of reptiles is decreasing, while the number of endangered amphibian species is increasing. Therefore C is incorrect.
D In 2001, there were exactly four times as many endangered species of birds as there were endangered species of reptiles.
Red flag: EXACTLY. This can be disproved by finding the markers around the numbers. The number of endangered species of birds in 2001 can be found exactly at 1200. This means that we need to prove that the number of endangered species of reptiles is either at 300 or else this answer is incorrect. Although the endangered species of reptiles is between 200-400, we can clearly see it is much less than halfway between and so it cannot be exactly 300. Therefore D is incorrect.
E More species of bird became endangered over the three-year period than any other animal class.
We need to see if the increase in any other bar in this graph is greater than the birds’ over a three-year period. Reptiles can be eliminated as they are decreasing. Mammals increase but then decrease to the original level so there is no net change. Insects and fish are also decreasing. This leaves us with amphibians, which are also increasing. Although difficult to see, the bar for amphibians is increasing the most. To confirm this on test day, take something like your pen and pick a reference point. Then see which bar moves furthest from the reference point when aligned (makeshift ruler almost). Be careful to only do this when the numbers are not indicative. Therefore E is incorrect.