I know about enzymes but I don’t understand how to solve such questions that involve a graph. Can anyone help?
The correct graph in this case would be A.
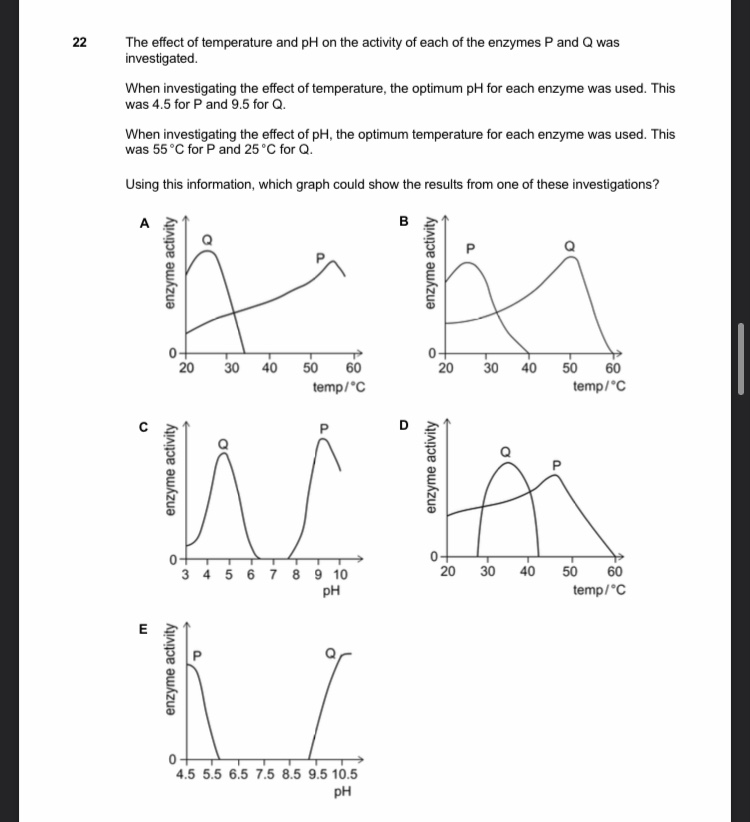
Enzyme activity usually decrease after the optimum temperature and pH.
The optimum for Q is 25°C and for P it’s 55°C. From the graph A it is observable that after 25° and 55° the graph for P and Q goes down which means it has exceeded the optimum value and the enzyme has been denatured. It shows a decrease in the enzyme activity.
Someone correct me If I’m wrong.
Hello! I figured the answer could be A though I still don’t know it for sure. Anyway, can you explain why E can’t be the answer? The way I see it, it just mirrors (A) but with Ph instead of temp.
Edit: I mean I guess the optimal Ph for q is not perfectly aligned with the peak, but is that really the reason why it’s wrong?
Hey, I think so, because if the optimum for Q is 9.5 then the graph should’ve shown a decrease starting from 9.5 instead of increase . But in this, the enzyme activity is increasing after 9.5 and peak of the graph is shown at pH 10.5 which I think , is not correct as the enzymes are highly sensitive to pH and it degenerates at this pH, as it has exceeded the optimum. This is the reason why I think E is wrong
Again, I don’t know if this is the correct explanation for why E ,couldn’t be the answer. Please correct me if I’m wrong. ![]()
1 Like