The graph shows the volume of a subject’s lungs measured over a period of 40 seconds.
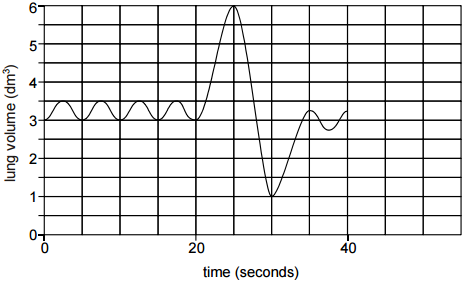
Determine the total volume of air breathed in during the 40 seconds (give your answer to the nearest 0.25dm3).
A. 7.75 dm3
B. 8 dm3
C. 8.5 dm3
D. 8.75 dm3
E. 9.10 dm3
How to interpret this type of graphs?
